73 Kenyon St E
This feature is unavailable at the moment.
We apologize, but the feature you are trying to access is currently unavailable. We are aware of this issue and our team is working hard to resolve the matter.
Please check back in a few minutes. We apologize for the inconvenience.
- LoopNet Team
thank you

Your email has been sent!
73 Kenyon St E
8 Unit Apartment Building $1,528,726 USD ($191,091 USD/Unit) 4.86% Cap Rate Alexandria, ON K0C 1A0


Investment Highlights
- Modern 8-unit building
- Building offers modern features, durability, and energy efficiency
- Alexandria's advantageous location provides easy access to neighboring cities
Executive Summary
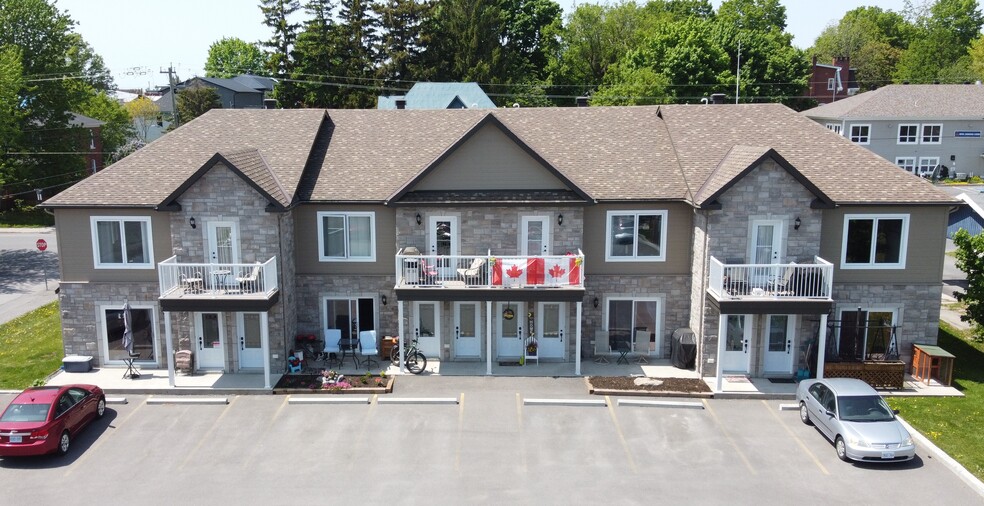
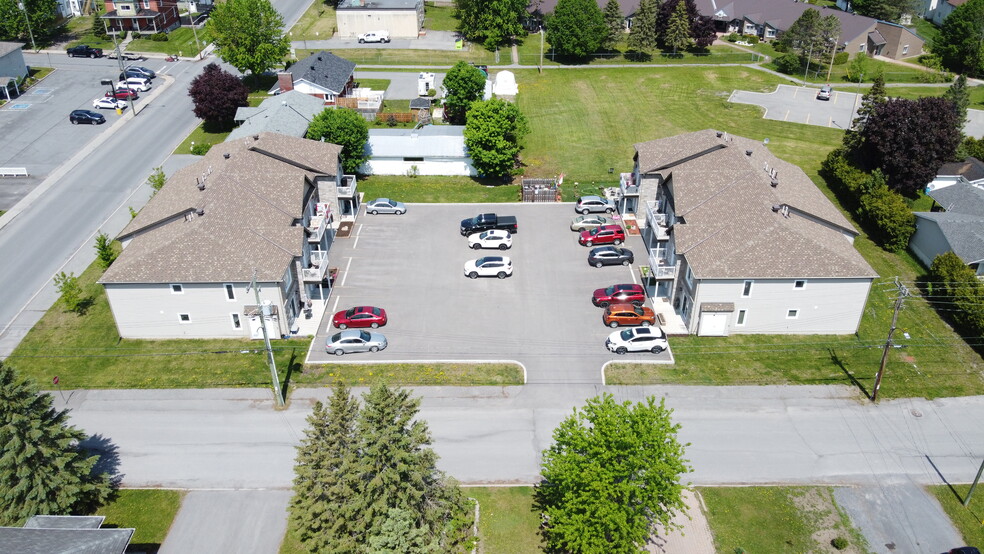
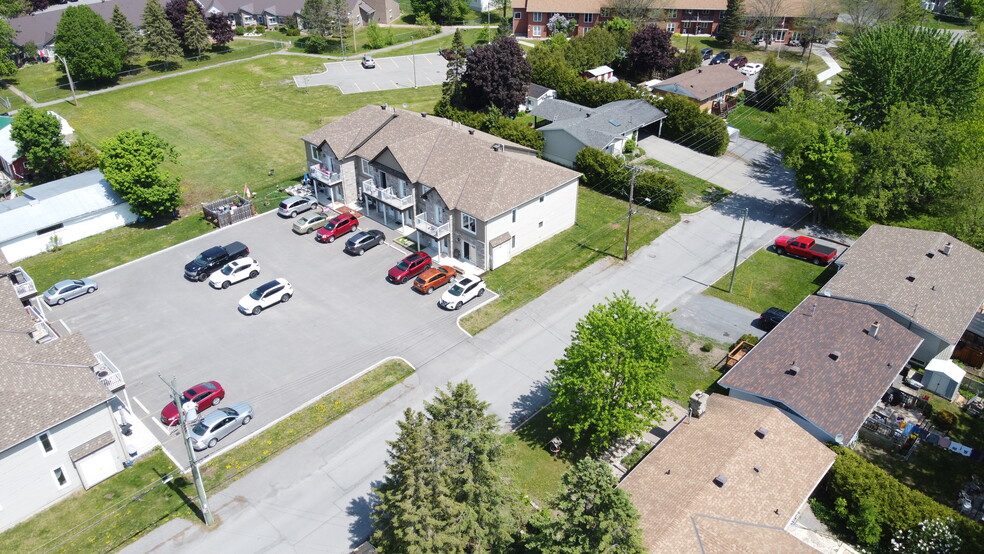
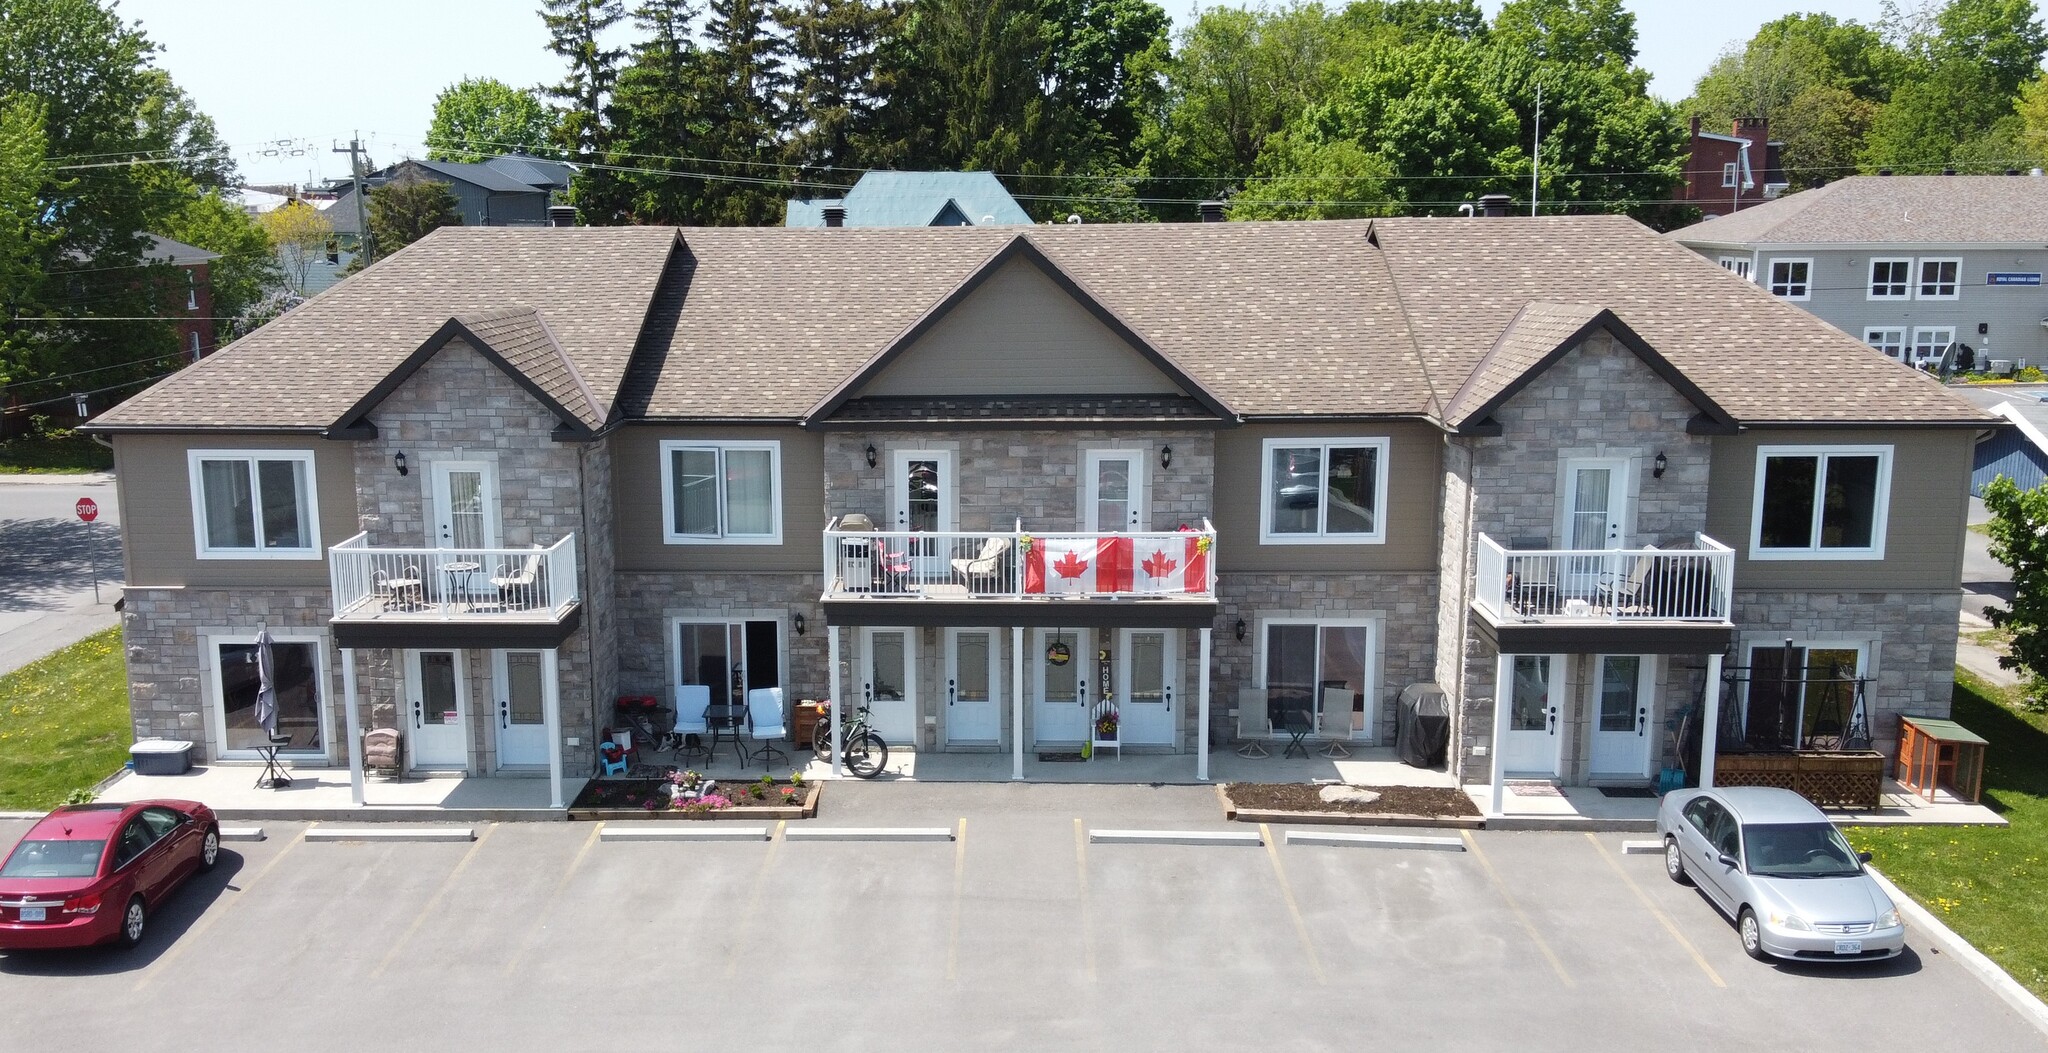
Welcome to 73 Kenyon Street East in Alexandria. Modern 8-unit building featuring spacious 2-bedroom units, approx. 1000 square feet per unit. Each boasting its own exterior entrance & the added convenience of a private balcony/terrace. Situated in the charming town of Alexandria, residents enjoy a convenient location and a strong sense of community. Alexandria's advantageous location provides easy access to neighboring cities. Each unit is equipped with a forced air gas furnace and electric hot water tank. Tenants pay for their own utility costs. Investors will appreciate the potential for rental income and value appreciation in Alexandria. With these buildings being recently constructed in 2018, they offer modern features, durability, and energy efficiency. As tenants move out over time, there is an opportunity to increase rents and maximize returns in this thriving real estate market. Don't miss out on the chance to be part of Alexandria's growth. 75 Kenyon also for sale.
Financial Summary (Actual - 2023) |
Annual (USD) | Annual Per SF (USD) |
|---|---|---|
| Gross Rental Income |
$82,903

|
$10.36

|
| Other Income |
-

|
-

|
| Vacancy Loss |
-

|
-

|
| Effective Gross Income |
$82,903

|
$10.36

|
| Taxes |
$2,497

|
$0.31

|
| Operating Expenses |
$7,031

|
$0.88

|
| Total Expenses |
$9,529

|
$1.19

|
| Net Operating Income |
$73,375

|
$9.17

|
Financial Summary (Actual - 2023)
| Gross Rental Income (USD) | |
|---|---|
| Annual | $82,903 |
| Annual Per SF | $10.36 |
| Other Income (USD) | |
|---|---|
| Annual | - |
| Annual Per SF | - |
| Vacancy Loss (USD) | |
|---|---|
| Annual | - |
| Annual Per SF | - |
| Effective Gross Income (USD) | |
|---|---|
| Annual | $82,903 |
| Annual Per SF | $10.36 |
| Taxes (USD) | |
|---|---|
| Annual | $2,497 |
| Annual Per SF | $0.31 |
| Operating Expenses (USD) | |
|---|---|
| Annual | $7,031 |
| Annual Per SF | $0.88 |
| Total Expenses (USD) | |
|---|---|
| Annual | $9,529 |
| Annual Per SF | $1.19 |
| Net Operating Income (USD) | |
|---|---|
| Annual | $73,375 |
| Annual Per SF | $9.17 |
Property Facts
| Price | $1,528,726 USD | Building Class | C |
| Price Per Unit | $191,091 USD | Lot Size | 0.39 AC |
| Sale Type | Investment | Building Size | 8,000 SF |
| Cap Rate | 4.86% | Average Occupancy | 100% |
| No. Units | 8 | No. Stories | 2 |
| Property Type | Multifamily | Year Built | 2018 |
| Property Subtype | Apartment | Parking Ratio | 1.13/1,000 SF |
| Apartment Style | Low Rise |
| Price | $1,528,726 USD |
| Price Per Unit | $191,091 USD |
| Sale Type | Investment |
| Cap Rate | 4.86% |
| No. Units | 8 |
| Property Type | Multifamily |
| Property Subtype | Apartment |
| Apartment Style | Low Rise |
| Building Class | C |
| Lot Size | 0.39 AC |
| Building Size | 8,000 SF |
| Average Occupancy | 100% |
| No. Stories | 2 |
| Year Built | 2018 |
| Parking Ratio | 1.13/1,000 SF |
Unit Amenities
- Balcony
Unit Mix Information
| Description | No. Units | Avg. Rent/Mo | SF |
|---|---|---|---|
| 2+1 | 8 | - | - |
1 of 1
1 of 6
VIDEOS
3D TOUR
PHOTOS
STREET VIEW
STREET
MAP
1 of 1
Presented by

73 Kenyon St E
Already a member? Log In
Hmm, there seems to have been an error sending your message. Please try again.
Thanks! Your message was sent.


