SFR Investment Portfolio
This feature is unavailable at the moment.
We apologize, but the feature you are trying to access is currently unavailable. We are aware of this issue and our team is working hard to resolve the matter.
Please check back in a few minutes. We apologize for the inconvenience.
- LoopNet Team
thank you

Your email has been sent!
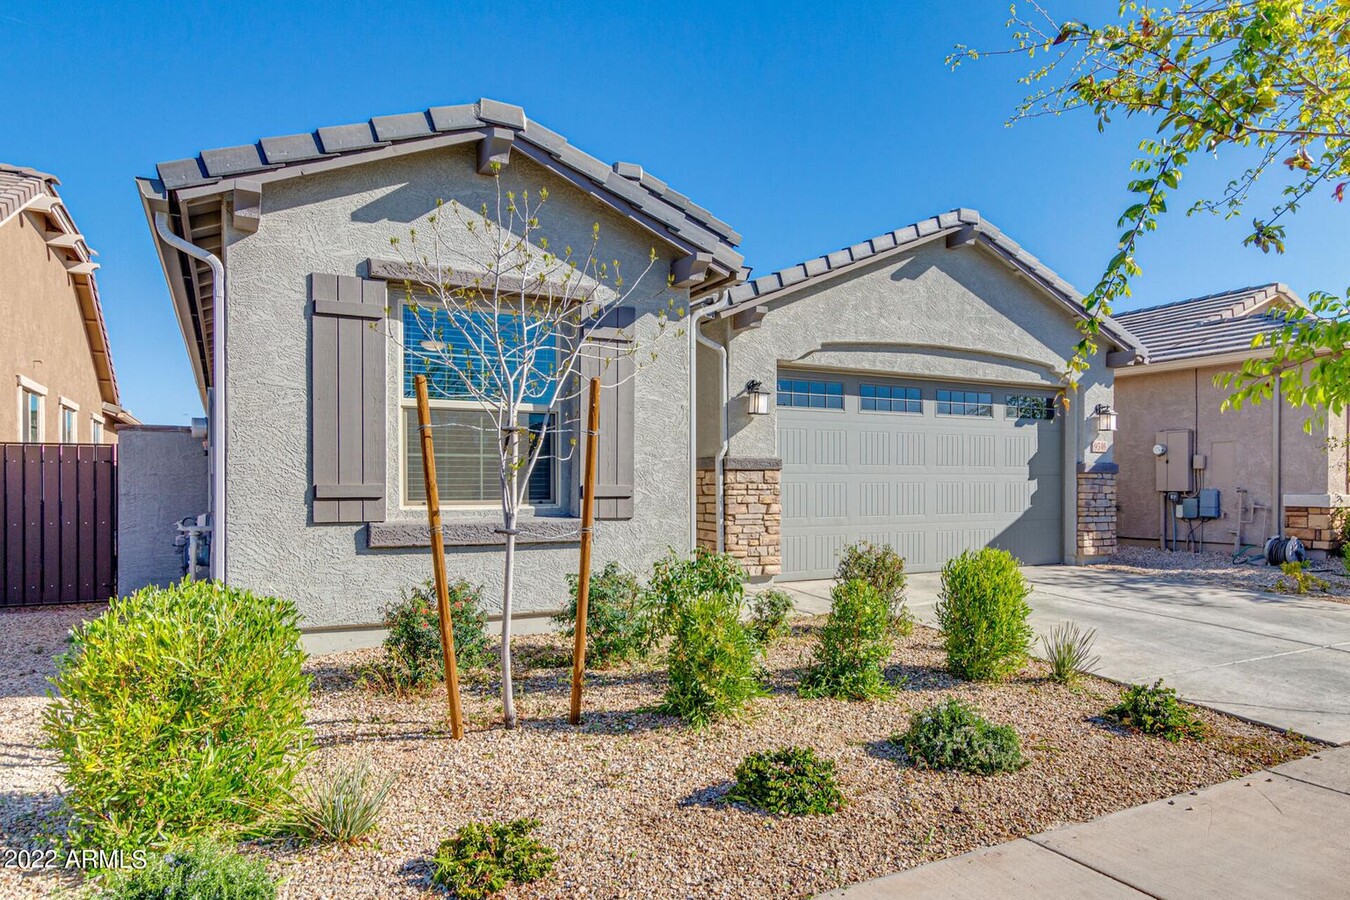
SFR Investment Portfolio
12 Multifamily Properties Offered at $7,500,000 in Multiple Locations

INVESTMENT HIGHLIGHTS
- Turnkey investment opportunity.
- Long term lease.
- East Valley
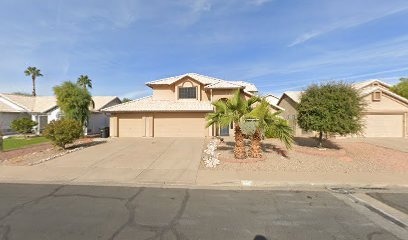
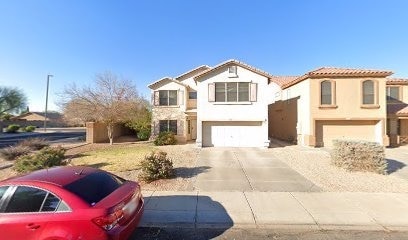
- All single family detached.
EXECUTIVE SUMMARY
Turnkey investment portfolio available with all homes located in the high demand east valley of the Phoenix MSA. All properties are fully rented on long term leases. Some properties have value-add opportunities for even higher rents and equity.
TAXES & OPERATING EXPENSES (PRO FORMA - 2024) Click Here to Access |
ANNUAL |
|---|---|
| Gross Rental Income |
$99,999

|
| Other Income |
-
|
| Vacancy Loss |
-
|
| Effective Gross Income |
$99,999
|
| Taxes |
$99,999
|
| Operating Expenses |
$99,999
|
| Total Expenses |
$99,999
|
| Net Operating Income |
$99,999
|
TAXES & OPERATING EXPENSES (PRO FORMA - 2024) Click Here to Access
| Gross Rental Income | |
|---|---|
| Annual | $99,999 |
| Other Income | |
|---|---|
| Annual | - |
| Vacancy Loss | |
|---|---|
| Annual | - |
| Effective Gross Income | |
|---|---|
| Annual | $99,999 |
| Taxes | |
|---|---|
| Annual | $99,999 |
| Operating Expenses | |
|---|---|
| Annual | $99,999 |
| Total Expenses | |
|---|---|
| Annual | $99,999 |
| Net Operating Income | |
|---|---|
| Annual | $99,999 |
PROPERTY FACTS
| Price | $7,500,000 | Status | Active |
| Price / SF | $295.61 / SF | Number of Properties | 12 |
| Sale Condition | Bulk/Portfolio Sale | Individually For Sale | 0 |
| Cap Rate | 4.94% | Total Building Size | 25,371 SF |
| Sale Type | Investment | Total Land Area | 1.67 AC |
| Price | $7,500,000 |
| Price / SF | $295.61 / SF |
| Sale Condition | Bulk/Portfolio Sale |
| Cap Rate | 4.94% |
| Sale Type | Investment |
| Status | Active |
| Number of Properties | 12 |
| Individually For Sale | 0 |
| Total Building Size | 25,371 SF |
| Total Land Area | 1.67 AC |
PROPERTIES
| PROPERTY NAME / ADDRESS | PROPERTY TYPE | SIZE | YEAR BUILT | INDIVIDUAL PRICE |
|---|---|---|---|---|
| 3424 E Melody Ln, Gilbert, AZ 85234 | Multifamily | 2,623 SF | 2011 | - |
| 1770 E Buffalo St, Chandler, AZ 85225 | Multifamily | 2,244 SF | 1996 | - |
| 9546 E Tesla Ave, Mesa, AZ 85212 | Multifamily | 1,934 SF | 2020 | - |
| 3668 E Parkview Dr, Gilbert, AZ 85295 | Multifamily | 2,412 SF | 2005 | - |
| 905 W Sun Coast Dr, Gilbert, AZ 85233 | Multifamily | 1,667 SF | 1990 | - |
| 1373 E Tyson St, Chandler, AZ 85225 | Multifamily | 3,050 SF | 1997 | - |
| 1769 W El Monte Plz, Chandler, AZ 85224 | Multifamily | 1,326 SF | 1981 | - |
| 1808 E Galveston St, Gilbert, AZ 85295 | Multifamily | 2,222 SF | 1998 | - |
| 4108 E San Remo Ave, Gilbert, AZ 85234 | Multifamily | 2,171 SF | 1993 | - |
| 941 S Abalone Dr, Gilbert, AZ 85233 | Multifamily | 2,171 SF | 1993 | - |
| 34853 N Open Range Dr, Queen Creek, AZ 85142 | Multifamily | 1,195 SF | 2006 | - |
| 1970 E Ross Dr, Chandler, AZ 85225 | Multifamily | 2,356 SF | 1999 | - |
1 of 1

1 of 4
VIDEOS
3D TOUR
PHOTOS
STREET VIEW
STREET
MAP

1 of 1
Presented by

SFR Investment Portfolio
Already a member? Log In
Hmm, there seems to have been an error sending your message. Please try again.
Thanks! Your message was sent.