Property Record
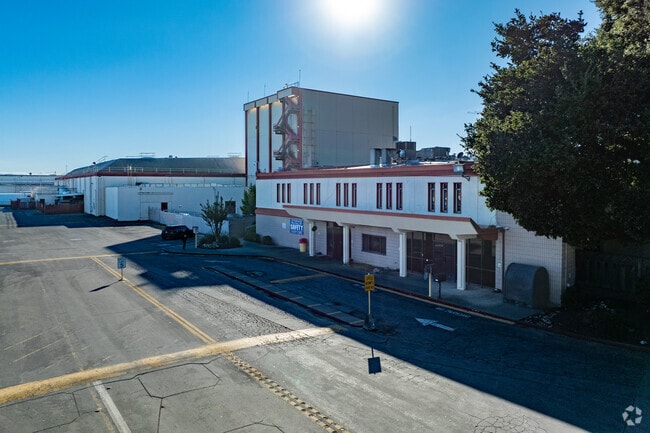
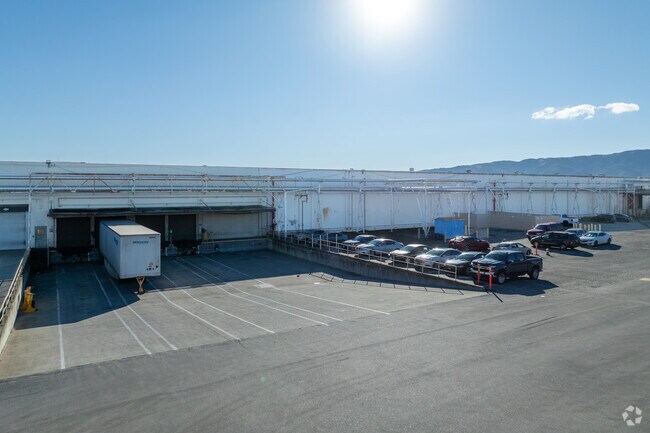
1350 Pacheco Pass Hwy, Gilroy, CA 95020


Property Detail
1350 Pacheco Pass Hwy
Foodprocessing
Santa Clara
M2
California
AE The base floodplain where base flood elevations are provided. AE Zones are now used on new format FIRMs instead of A1-A30 Zones.
40.33 AC
2024
Gilroy
2025
South Bay/San Jose
512602
San Jose-Sunnyvale-Santa Clara, CA
921,750 SF
841-17-098
NEARBY LISTINGS FOR SALE OR LEASE
DEMOGRAPHICS near 1350 Pacheco Pass Hwy
1 mile
3 mile
5 mile
2025 Total Population
229
35,272
64,675
2030 Population
224
35,969
65,908
Pop Growth 2025-2030
(2.18%)
+ 1.98%
+ 1.91%
Average Age
39
37
39
2025 Total Households
68
10,067
18,962
HH Growth 2025-2030
(2.94%)
+ 1.92%
+ 1.90%
Median Household Inc
$141,666
$115,090
$127,929
Avg Household Size
3.20
3.30
3.30
2025 Avg HH Vehicles
3.00
2.00
2.00
Median Home Value
$555,555
$863,334
$987,986
Median Year Built
1970
1981
1988
Nearby Places
Map Layers
Map Styles
 Street
 Aerial
Layers
 Traffic
 Biking
Places
Listings with unknown addresses are not visible on the map
- Restaurants
- Banks
- Shops
- Fitness
- Groceries
PUBLIC TRANSPORTATION
COMMUTER RAIL
Drive
Walk
Distance
4 min
1.8 mi
Drive
Walk
Distance
12 min
8.1 mi
AIRPORT
Norman Y Mineta San Jose International
Drive
Walk
Distance
Norman Y Mineta San Jose International
46 min
36.3 mi
Monterey Regional
Drive
Walk
Distance
Monterey Regional
52 min
41.8 mi
Freight Ports
Port of Redwood City
Drive
Walk
Distance
Port of Redwood City
67 min
54.4 mi
Nearby Properties
Address
Land Use
TOTAL SIZE
Lot Size
Zoning
Address
Land Use
TOTAL SIZE
Lot Size
Zoning
270,205 SF
6.65 AC
M2
Address
Land Use
TOTAL SIZE
Lot Size
Zoning
171,339 SF
16.43 AC
C3
Address
Land Use
TOTAL SIZE
Lot Size
Zoning
133,498 SF
12.16 AC
C3
Address
Land Use
TOTAL SIZE
Lot Size
Zoning
189,303 SF
28.73 AC
CM
Address
Land Use
TOTAL SIZE
Lot Size
Zoning
55.03 AC
AW
Address
Land Use
TOTAL SIZE
Lot Size
Zoning
113,883 SF
9.63 AC
C1
Address
Land Use
TOTAL SIZE
Lot Size
Zoning
103,974 SF
3.90 AC
R4
Address
Land Use
TOTAL SIZE
Lot Size
Zoning
172,348 SF
9.58 AC
A140
Address
Land Use
TOTAL SIZE
Lot Size
Zoning
11.04 AC
M2
Address
Land Use
TOTAL SIZE
Lot Size
Zoning
9.90 AC
M2
Address
Land Use
TOTAL SIZE
Lot Size
Zoning
94,345 SF
10.68 AC
C1
Address
Land Use
TOTAL SIZE
Lot Size
Zoning
219,622 SF
19.80 AC
A1-25
Address
Land Use
TOTAL SIZE
Lot Size
Zoning
56.33 AC
M2
Address
Land Use
TOTAL SIZE
Lot Size
Zoning
59.87 AC
M2
Address
Land Use
TOTAL SIZE
Lot Size
Zoning
142,684 SF
4.94 AC
CD
Address
Land Use
TOTAL SIZE
Lot Size
Zoning
123,268 SF
7.62 AC
R3
Address
Land Use
TOTAL SIZE
Lot Size
Zoning
64,893 SF
4.32 AC
R3
Address
Land Use
TOTAL SIZE
Lot Size
Zoning
72,159 SF
4.16 AC
R3
Address
Land Use
TOTAL SIZE
Lot Size
Zoning
148,663 SF
14.79 AC
PUD
Address
Land Use
TOTAL SIZE
Lot Size
Zoning
4,853 SF
11.59 AC
HC
Address
Land Use
TOTAL SIZE
Lot Size
Zoning
32,727 SF
1.82 AC
M2
Address
Land Use
TOTAL SIZE
Lot Size
Zoning
129,000 SF
6.84 AC
MULIT
Address
Land Use
TOTAL SIZE
Lot Size
Zoning
63,560 SF
7.63 AC
A1-25
Address
Land Use
TOTAL SIZE
Lot Size
Zoning
123,709 SF
9.26 AC
M2
Address
Land Use
TOTAL SIZE
Lot Size
Zoning
56,020 SF
2.61 AC
M2
Address
Land Use
TOTAL SIZE
Lot Size
Zoning
126,503 SF
4.61 AC
MI
Address
Land Use
TOTAL SIZE
Lot Size
Zoning
20,140.41 AC
SJ
Address
Land Use
TOTAL SIZE
Lot Size
Zoning
163,200 SF
8.62 AC
M-2
The World's #1 Commercial Real Estate Marketplace
Connect with us
© 2026 CoStar Group
The information above has been obtained from sources believed reliable. While we do not doubt its accuracy we have not verified it and make no guarantee, warranty or representation about it. It is your responsibility to independently confirm its accuracy and completeness. Any projections, opinions, assumptions, or estimates used are for example only and do not represent the current or future performance of the property. The value of this transaction to you depends on tax and other factors which should be evaluated by your tax, financial, and legal advisors. You and your advisors should conduct a careful, independent investigation of the property to determine to your satisfaction the suitability of the property for your needs.