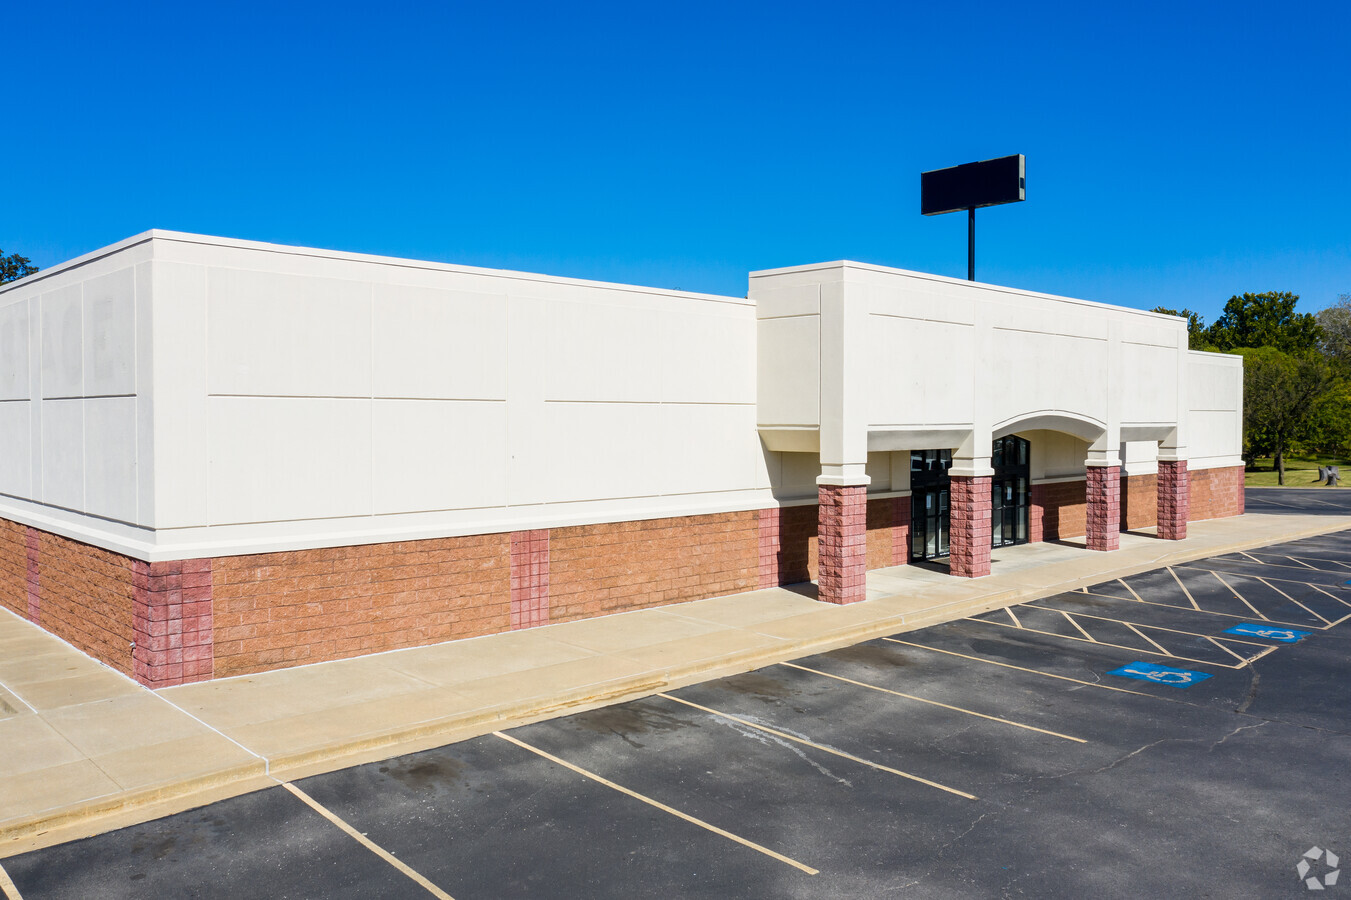
Property Record
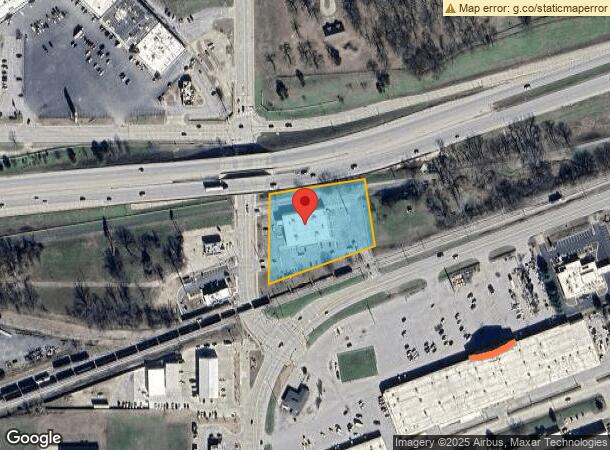
651 E Charles Page Blvd, Sand Springs, OK 74063
NEARBY LISTINGS FOR SALE OR LEASE
Property Detail
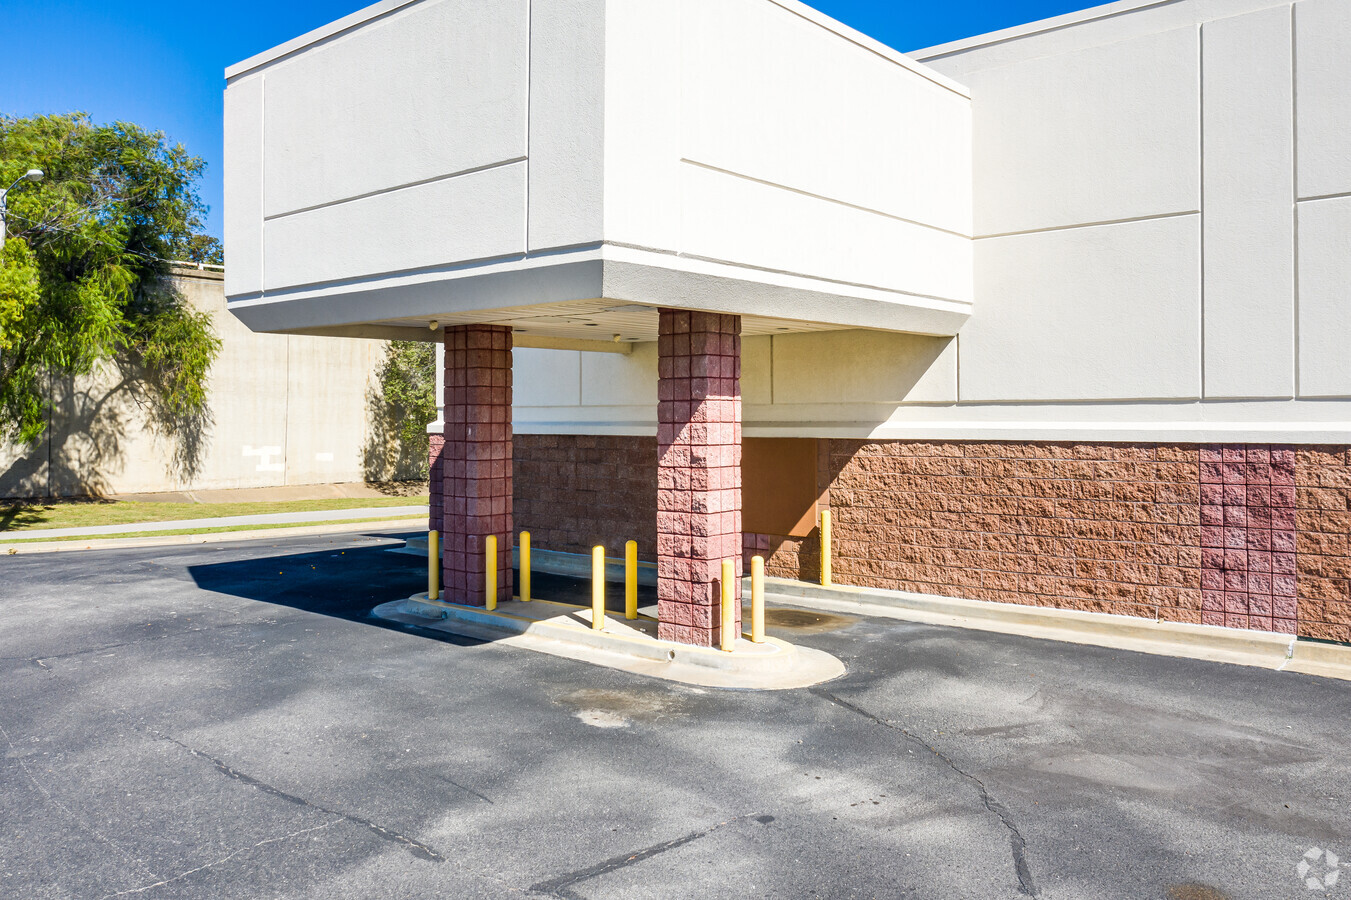
651 E Charles Page Blvd
Tulsa, OK
Page Springs
62210-91-12-43070
LT 1 BLK 1
Storebuilding
Tulsa
X
Oklahoma
40113C1240K
1
2023
1.85 AC
2024
West Tulsa
009200
Tulsa
14,000 SF
DEMOGRAPHICS near 651 E Charles Page Blvd
1 Mile
3 Mile
5 Mile
2024 Total Population
4,329
21,774
40,340
2029 Population
4,509
22,682
41,931
Pop Growth 2024-2029
+ 4.16%
+ 4.17%
+ 3.94%
Average Age
39
40
40
2024 Total Households
1,782
8,634
15,982
HH Growth 2024-2029
+ 4.32%
+ 4.30%
+ 4.02%
Median Household Inc
$51,701
$58,866
$57,551
Avg Household Size
2.40
2.50
2.50
2024 Avg HH Vehicles
2.00
2.00
2.00
Median Home Value
$150,994
$156,461
$148,522
Median Year Built
1959
1969
1970
Nearby Places
- Restaurants
- Banks
- Shops
- Fitness
- Groceries
PUBLIC TRANSPORTATION
AIRPORT
Tulsa International
DRIVE
WALK
Distance
Tulsa International
23 min
15.4 mi
Freight Ports
Tulsa Port Of Catoosa
DRIVE
WALK
Distance
Tulsa Port Of Catoosa
33 min
24.7 mi
SALE & LEASE HISTORY
LISTING DATE
SALE/LEASE

Sep 25, 2016
For Lease
Sep 24, 2016
For Sale
Oct 08, 2020
For Lease
Nearby Properties
Address
Land Use
TOTAL SIZE
Lot Size
Zoning
Address
Land Use
TOTAL SIZE
Lot Size
Zoning
Address
Land Use
TOTAL SIZE
Lot Size
Zoning
92,076 SF
81.28 AC
IM
Address
Land Use
TOTAL SIZE
Lot Size
Zoning
142,214 SF
98.12 AC
AG
Address
Land Use
TOTAL SIZE
Lot Size
Zoning
174,776 SF
9.46 AC
RM2
Address
Land Use
TOTAL SIZE
Lot Size
Zoning
101,827 SF
30.64 AC
RS1
Address
Land Use
TOTAL SIZE
Lot Size
Zoning
15,747 SF
2.50 AC
CM
Address
Land Use
TOTAL SIZE
Lot Size
Zoning
35,753 SF
9.17 AC
IH
Address
Land Use
TOTAL SIZE
Lot Size
Zoning
44,238 SF
13.45 AC
CG
Address
Land Use
TOTAL SIZE
Lot Size
Zoning
32,827 SF
4.22 AC
CS
Address
Land Use
TOTAL SIZE
Lot Size
Zoning
108,279 SF
6.38 AC
AG
Address
Land Use
TOTAL SIZE
Lot Size
Zoning
22,078 SF
5.08 AC
CS
Address
Land Use
TOTAL SIZE
Lot Size
Zoning
28,240 SF
147.33 AC
NCU
Address
Land Use
TOTAL SIZE
Lot Size
Zoning
45,125 SF
7.04 AC
RM1
Address
Land Use
TOTAL SIZE
Lot Size
Zoning
21,170 SF
0.17 AC
CH
Address
Land Use
TOTAL SIZE
Lot Size
Zoning
41,456 SF
2.39 AC
RS2
Address
Land Use
TOTAL SIZE
Lot Size
Zoning
81,444 SF
1.19 AC
RS3
Address
Land Use
TOTAL SIZE
Lot Size
Zoning
27,222 SF
10.49 AC
IL
Address
Land Use
TOTAL SIZE
Lot Size
Zoning
315,085 SF
113.92 AC
IM
Address
Land Use
TOTAL SIZE
Lot Size
Zoning
15,985 SF
39.10 AC
AG
Address
Land Use
TOTAL SIZE
Lot Size
Zoning
51,678 SF
5.14 AC
RS1
Address
Land Use
TOTAL SIZE
Lot Size
Zoning
108,900 SF
6.82 AC
IM
Address
Land Use
TOTAL SIZE
Lot Size
Zoning
44,238 SF
9.11 AC
IH
Address
Land Use
TOTAL SIZE
Lot Size
Zoning
197,063 SF
11.23 AC
RM2
Address
Land Use
TOTAL SIZE
Lot Size
Zoning
70,910 SF
6.73 AC
IM
Address
Land Use
TOTAL SIZE
Lot Size
Zoning
17,012 SF
3.32 AC
CS
Address
Land Use
TOTAL SIZE
Lot Size
Zoning
27,426 SF
9 AC
RE
Address
Land Use
TOTAL SIZE
Lot Size
Zoning
207,138 SF
14.17 AC
CG
Address
Land Use
TOTAL SIZE
Lot Size
Zoning
28,347 SF
2.07 AC
RS
Address
Land Use
TOTAL SIZE
Lot Size
Zoning
8,784 SF
7.93 AC
CG
The World's #1 Commercial Real Estate Marketplace
Connect with us
© 2025 CoStar Group
The information above has been obtained from sources believed reliable. While we do not doubt its accuracy we have not verified it and make no guarantee, warranty or representation about it. It is your responsibility to independently confirm its accuracy and completeness. Any projections, opinions, assumptions, or estimates used are for example only and do not represent the current or future performance of the property. The value of this transaction to you depends on tax and other factors which should be evaluated by your tax, financial, and legal advisors. You and your advisors should conduct a careful, independent investigation of the property to determine to your satisfaction the suitability of the property for your needs.