Property Record
9413 Se Maricamp Rd, Ocala, FL 34472

NEARBY LISTINGS FOR SALE OR LEASE
Property Detail
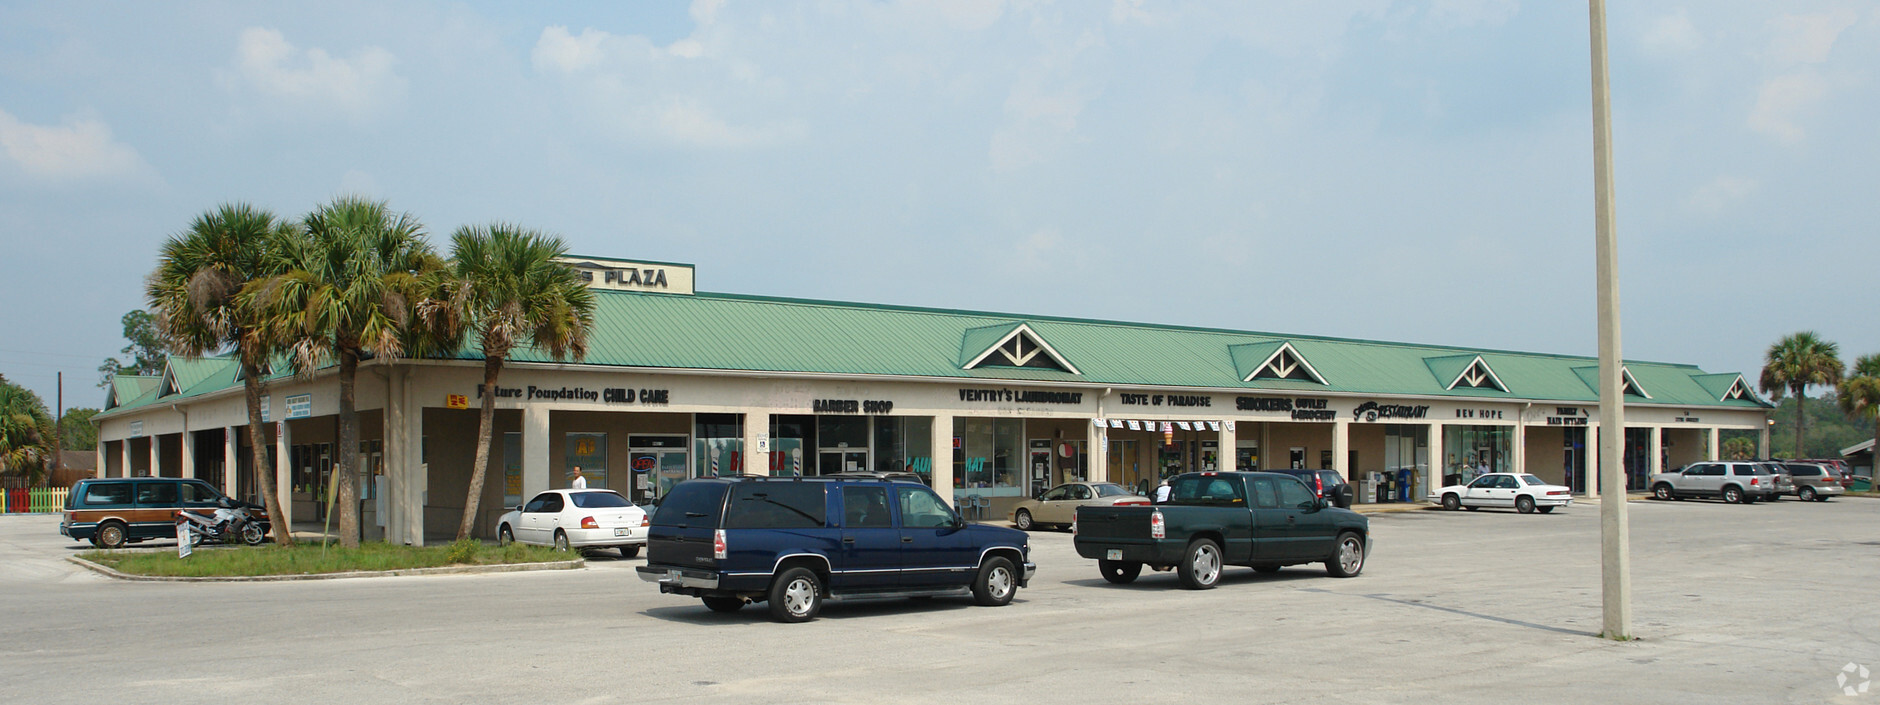
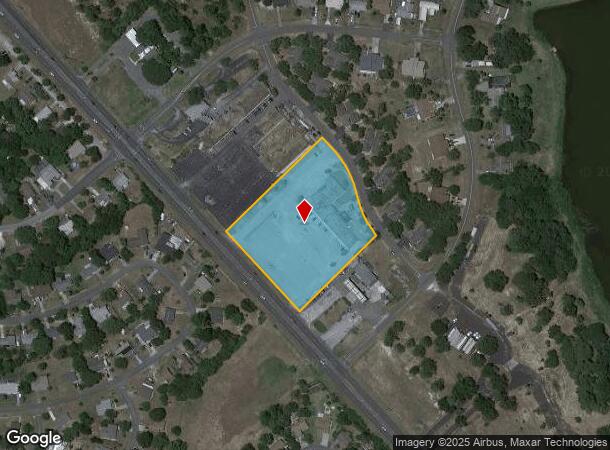
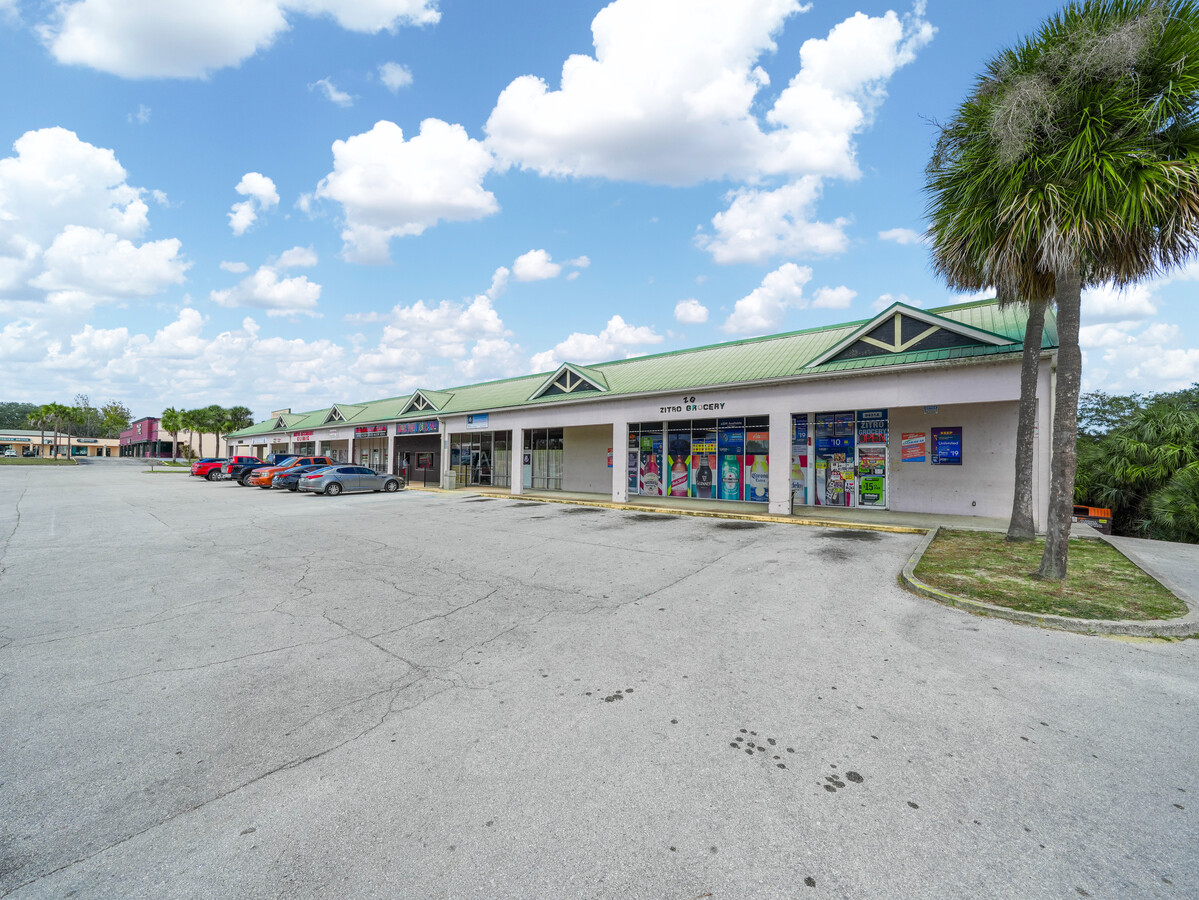
9413 Se Maricamp Rd
Ocala, FL
Silver Springs Shores
9015-0197-02
SEC 16 TWP 16 RGE 23 PLAT BOOK J PAGE 232 SILVER SPRINGS SHORES UNIT 15 REPLAT BLK 197 LOT 2
Regionalshoppingcenterormallwithanchorstore
Marion
X
Florida
12083C0735D
2
2023
3.65 AC
2023
Outlying Marion County
001211
Ocala
19,416 SF
DEMOGRAPHICS near 9413 Se Maricamp Rd
1 Mile
3 Mile
5 Mile
2024 Total Population
8,684
27,676
61,981
2029 Population
10,038
31,887
70,727
Pop Growth 2024-2029
+ 15.59%
+ 15.22%
+ 14.11%
Average Age
41
40
41
2024 Total Households
3,529
10,535
24,316
HH Growth 2024-2029
+ 16.24%
+ 15.48%
+ 14.14%
Median Household Inc
$41,294
$48,481
$53,604
Avg Household Size
2.40
2.60
2.50
2024 Avg HH Vehicles
2.00
2.00
2.00
Median Home Value
$105,026
$147,769
$167,116
Median Year Built
1982
1994
1995
Nearby Places
- Restaurants
- Banks
- Shops
- Fitness
- Groceries
SALE & LEASE HISTORY
LISTING DATE
SALE/LEASE

Nov 14, 2024
For Sale
Mar 28, 2018
For Sale
Jun 25, 2021
For Sale
Jun 01, 2018
For Sale
Jan 18, 2019
For Sale
Aug 22, 2017
For Sale
Nearby Properties
Address
Land Use
TOTAL SIZE
Lot Size
Zoning
Address
Land Use
TOTAL SIZE
Lot Size
Zoning
246,762 SF
55.08 AC
PUD
Address
Land Use
TOTAL SIZE
Lot Size
Zoning
188,132 SF
35.86 AC
B4
Address
Land Use
TOTAL SIZE
Lot Size
Zoning
71,791 SF
10.86 AC
B2
Address
Land Use
TOTAL SIZE
Lot Size
Zoning
680,069 SF
62.96 AC
B5
Address
Land Use
TOTAL SIZE
Lot Size
Zoning
97,576 SF
23.01 AC
R3
Address
Land Use
TOTAL SIZE
Lot Size
Zoning
11,692 SF
503.98 AC
GU
Address
Land Use
TOTAL SIZE
Lot Size
Zoning
1,800 SF
954.07 AC
A1
Address
Land Use
TOTAL SIZE
Lot Size
Zoning
179,346 SF
13.22 AC
M1
Address
Land Use
TOTAL SIZE
Lot Size
Zoning
78,133 SF
20.10 AC
GU
Address
Land Use
TOTAL SIZE
Lot Size
Zoning
137,302 SF
28.57 AC
M1
Address
Land Use
TOTAL SIZE
Lot Size
Zoning
26,020 SF
10.46 AC
B2
Address
Land Use
TOTAL SIZE
Lot Size
Zoning
167,690 SF
19.53 AC
M2
Address
Land Use
TOTAL SIZE
Lot Size
Zoning
69,860 SF
5.05 AC
B2
Address
Land Use
TOTAL SIZE
Lot Size
Zoning
682 SF
468.13 AC
A1
Address
Land Use
TOTAL SIZE
Lot Size
Zoning
37,862 SF
6.78 AC
R1
Address
Land Use
TOTAL SIZE
Lot Size
Zoning
93,120 SF
34.47 AC
PUD
Address
Land Use
TOTAL SIZE
Lot Size
Zoning
64,319 SF
7.60 AC
B2
Address
Land Use
TOTAL SIZE
Lot Size
Zoning
98,428 SF
10 AC
M2
Address
Land Use
TOTAL SIZE
Lot Size
Zoning
34,277 SF
14.94 AC
B5
Address
Land Use
TOTAL SIZE
Lot Size
Zoning
20,040 SF
2.77 AC
B4
Address
Land Use
TOTAL SIZE
Lot Size
Zoning
55,219 SF
8.83 AC
B2
Address
Land Use
TOTAL SIZE
Lot Size
Zoning
20,242 SF
4.23 AC
B4
Address
Land Use
TOTAL SIZE
Lot Size
Zoning
130,596 SF
12.49 AC
M2
Address
Land Use
TOTAL SIZE
Lot Size
Zoning
9,687 SF
118.25 AC
B5
Address
Land Use
TOTAL SIZE
Lot Size
Zoning
712.83 AC
A1
Address
Land Use
TOTAL SIZE
Lot Size
Zoning
8,782 SF
4.73 AC
B2
Address
Land Use
TOTAL SIZE
Lot Size
Zoning
52,704 SF
6.88 AC
M1
Address
Land Use
TOTAL SIZE
Lot Size
Zoning
53,142 SF
8.97 AC
M2
Address
Land Use
TOTAL SIZE
Lot Size
Zoning
17,595 SF
2.51 AC
B2
Address
Land Use
TOTAL SIZE
Lot Size
Zoning
23,659 SF
15.47 AC
A1
The World's #1 Commercial Real Estate Marketplace
Connect with us
© 2025 CoStar Group
The information above has been obtained from sources believed reliable. While we do not doubt its accuracy we have not verified it and make no guarantee, warranty or representation about it. It is your responsibility to independently confirm its accuracy and completeness. Any projections, opinions, assumptions, or estimates used are for example only and do not represent the current or future performance of the property. The value of this transaction to you depends on tax and other factors which should be evaluated by your tax, financial, and legal advisors. You and your advisors should conduct a careful, independent investigation of the property to determine to your satisfaction the suitability of the property for your needs.